
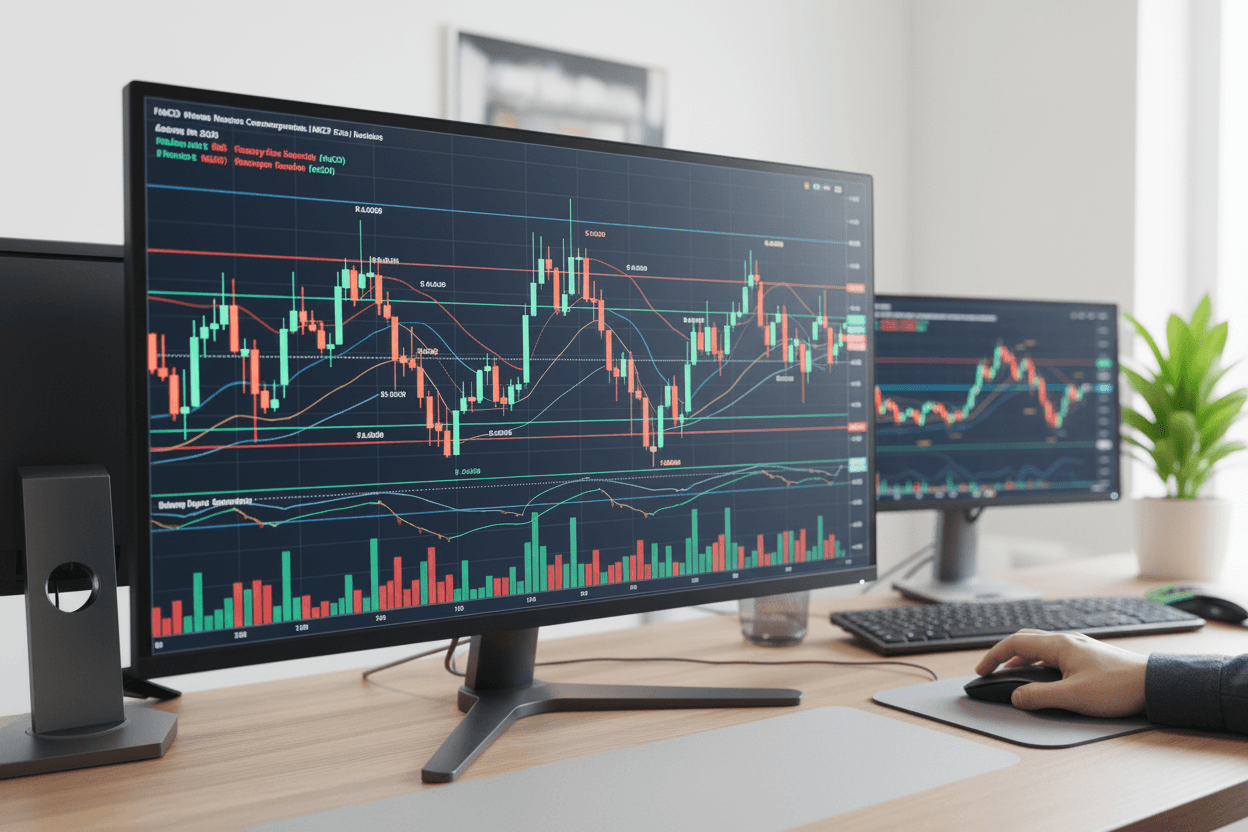
Candlestick patterns remain one of the most widely used tools in technical analysis. This course covers the ten most reliable patterns observed in Indian index and stock charts.
“A pattern is only as reliable as the volume and structure that confirm it.”
Applying Patterns to Real Charts
We apply each pattern to real historical Nifty and Bank Nifty charts and measure their historical success rate as a reversal or continuation signal.
Combining Signals to Reduce False Positives
The course closes with a framework for combining candlestick signals with volume and support/resistance to reduce false positives.
Technical AnalysisCandlestick Patterns